
Premier League 2026/27: Arsenal’s Defensive Fortress, Manchester City’s Attacking Power, and Brighton’s High-Risk Formula
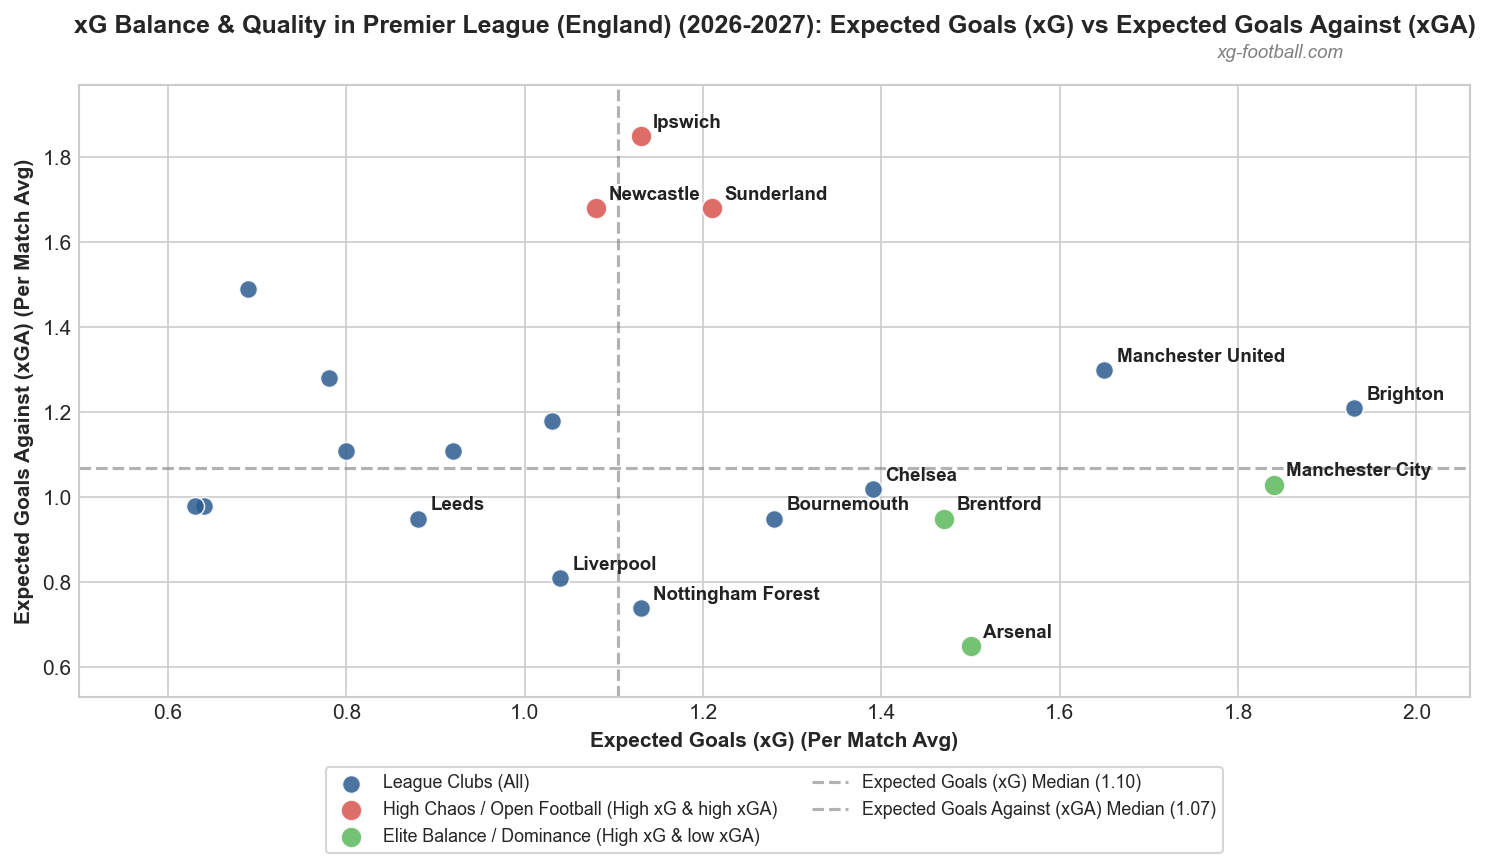
After eight matches of the 2026/27 Premier League season, expected-goals data reveals three distinct approaches to gaining an advantage. Arsenal combine disciplined defending with efficient chance creation, Manchester City lead the attacking numbers, and Brighton generate the highest xG of all the clubs listed — but concede more opportunities than the league’s most defensively secure sides.
The league medians stand at 1.10 expected goals (xG) and 1.07 expected goals against (xGA). These figures provide a useful benchmark for evaluating how effectively teams create chances and restrict their opponents.
The key measure is the difference between xG and xGA, known as the net xG balance. A positive figure means a team creates more expected goals than it allows. A negative figure suggests that opponents are generating the greater quality or volume of chances.
The most compelling teams are not necessarily those that attack the most. They are those that consistently create a meaningful advantage between the two penalty areas.
1. The Leaders: Different Routes to Dominance
Arsenal: Defensive control as a competitive advantage
Arsenal have the strongest net xG balance among the clubs listed, at +0.85 per match. Their attacking output of 1.50 xG is solid, but their defensive numbers are particularly striking: just 0.65 xGA.
That is the lowest xGA in the entire sample. Opponents are generating relatively few high-quality opportunities, suggesting that Arsenal are effective at controlling dangerous areas and limiting the quality of opposition attacks.
This profile points towards a team that can establish an advantage without needing to overwhelm opponents with attacking volume. Arsenal create enough to threaten regularly while making it difficult for rivals to respond.
Their defensive consistency is the defining feature of their statistical profile. If it continues over a longer run of matches, it could provide a strong foundation for a sustained title challenge. Eight games, however, are not enough to establish that this level of defensive performance will last throughout the season.
Manchester City: The league’s attacking engine
Manchester City lead the listed clubs with 1.84 xG per match, demonstrating the strongest expected-goals output in the sample. Their xGA stands at 1.03, giving them a net balance of +0.81.
City generate 0.34 more expected goals per game than Arsenal, but they also allow 0.38 more. The contrast highlights two different routes to a positive balance: Arsenal excel at restricting opponents, while City build their advantage around attacking production.
An xG of 1.84 suggests a consistent ability to generate promising scoring opportunities. The next step is to pair that attacking output with even tighter defensive control.
City’s profile remains highly competitive, but the figures suggest that reducing the quality of opposition chances could make their overall advantage more resilient.
Brighton: The most productive attack, with room to tighten up
Brighton record the highest xG in the sample at 1.93 per match, ahead of Manchester City and Arsenal. Their net balance of +0.72 is also strongly positive.
The complication is their xGA of 1.21. Brighton create more expected goals than any other listed side, but they allow opponents more opportunities than Arsenal, City, or Brentford.
That does not automatically mean their defensive structure is poor. A high defensive line, aggressive pressing, and a willingness to commit players forward can all increase exposure to counterattacks. The available data alone cannot establish which tactical factors are responsible.
Nevertheless, Brighton’s numbers reveal a clear trade-off: their attacking approach produces considerable threat, but their defensive exposure is greater than that of the leading control-oriented sides.
If they can reduce opposition chances without sacrificing their attacking output, their already strong net balance could improve further.
2. The Other Contenders: Balance, Efficiency, and Untapped Potential
Brentford offer one of the most balanced profiles in the sample. With 1.47 xG and 0.95 xGA, they produce a net balance of +0.52. Their attack sits comfortably above the league median, while their defensive numbers remain below one expected goal conceded per match.
This combination suggests a team capable of creating an advantage without relying entirely on attacking volume. Brentford may not match Brighton’s raw chance creation or City’s attacking output, but their balance between the two phases is impressive.
Nottingham Forest present a different picture. Their xGA of 0.74 is the second-lowest in the sample, yet their attacking output is only 1.13 xG. Their net balance of +0.39 reflects a defensive foundation that compensates for relatively modest chance creation.
Liverpool show a similar pattern, with 1.04 xG and 0.81 xGA. Their net balance remains positive at +0.23, but the attacking figure is slightly below the league median. Their defensive numbers are strong, although greater attacking production would give them more room to build an advantage.
Chelsea combine 1.39 xG with 1.02 xGA, producing a net balance of +0.37. Their numbers suggest a comparatively even profile: above-median chance creation and an xGA slightly below the league benchmark.
Manchester United generate 1.65 xG, making them one of the more productive attacking sides in the sample. However, their xGA of 1.30 is also relatively high, leaving a net balance of +0.35. The attacking potential is clear, but their defensive numbers leave room for improvement.
Bournemouth have a more restrained attacking profile, with 1.28 xG, but their xGA of 0.95 helps produce a positive balance of +0.33. They are not among the most prolific chance creators, yet they limit opponents sufficiently to maintain a meaningful statistical advantage.
Leeds United are the only club in the listed top ten with a negative net balance: 0.88 xG against 0.95 xGA, giving them −0.07. The difference is small, but it indicates that Leeds are not yet creating a consistent advantage over their opponents in terms of expected goals.
3. High Chaos: When Defensive Exposure Becomes a Problem
Some teams stand out not because of their attacking output, but because of the number of dangerous chances they allow.
Ipswich Town have the most concerning profile among the three high-xGA sides. They generate 1.13 xG but concede 1.85 xGA, resulting in a net balance of −0.72.
The gap is substantial. Ipswich create a reasonable volume of opportunities relative to the league median, but opponents generate far more expected goals against them. Unless the defensive numbers improve, their own attacking production may struggle to compensate.
Sunderland have 1.21 xG and 1.68 xGA, leaving a balance of −0.47. Their attacking output is slightly stronger than Ipswich’s, but the defensive exposure remains significant. Sunderland can create chances, yet they are allowing opponents too much opportunity to respond.
Newcastle United have the same 1.68 xGA as Sunderland, but their xG is lower at 1.08. Their net balance of −0.60 points to a problem at both ends: opponents create a high volume of expected goals, while Newcastle’s own attacking output is comparatively limited.
These profiles can produce matches that feel open and unpredictable, but high xGA should not automatically be equated with entertaining football or high actual scores. It measures the expected value of chances conceded, not the number of goals that will necessarily be scored.
For these teams, potential priorities include protecting central areas, improving defensive transitions, limiting access to dangerous shooting positions, and reducing the quality of chances conceded inside the penalty area.
4. Elite Tactical Control: Three Different Models
The three clubs highlighted for elite balance — Arsenal, Manchester City, and Brentford — illustrate how a positive xG differential can be built in different ways.
Arsenal prioritise defensive control. Their 0.65 xGA is the standout figure in the dataset. By restricting opposition chances, they create a foundation for consistent positive results even without leading the league in attacking output.
Manchester City prioritise attacking production. Their 1.84 xG is the highest among the listed teams. Their ability to generate chances gives them a substantial route to dominance, although their defensive numbers are less restrictive than Arsenal’s.
Brentford combine attacking output with defensive discipline. Their 1.47 xG and 0.95 xGA deliver a strong net balance without either extreme. They represent a more evenly distributed model of performance.
These figures describe statistical balance rather than proving which side has the best possession game, pressing structure, or territorial control. Those conclusions would require additional data. Still, the numbers reveal how different tactical profiles can produce a positive expected-goals advantage.
5. What the Numbers Tell Us — and What They Cannot
The leading net balances are Arsenal at +0.85, Manchester City at +0.81, and Brighton at +0.72. Brentford follow at +0.52.
Yet expected goals are not actual goals. A team can create excellent chances and fail to convert them, while an opponent may outperform its expected output through finishing or exceptional goalkeeping. Penalties, red cards, and individual match events can also distort short-term patterns.
The sample size matters, too. Eight matches are enough to identify early tendencies, but not enough to establish that every figure reflects a team's long-term level. The league medians provide context, not a complete picture of the distribution or reliability of each club’s numbers.
Conclusion: Arsenal Control, City Create, Brighton Attack
The first eight matches in this sample reveal three distinct approaches to gaining an advantage in the Premier League.
Arsenal combine a positive attacking output with the most restrictive defensive numbers. Manchester City lead the listed clubs in expected goals created, while Brighton push attacking production even higher but concede more opportunities than the leading defensive sides.
Brentford stand out for their balance, while Nottingham Forest and Liverpool show how defensive strength can offset relatively modest attacking output. At the other end, Ipswich, Sunderland, and Newcastle need to reduce the quality and volume of chances they allow if they are to improve their overall expected-goals balance.
The central lesson is that dominance is about more than creating chances. It is about creating more — and better — chances than the opposition. On the numbers provided, Arsenal currently offer the strongest combination of attacking threat and defensive control, while City and Brighton demonstrate how attacking power can create a different route to a positive balance.